Your customer spends less than 3 seconds deciding to stay on your listing or bounce to a competitor. If they have to read a wall of text to understand your product, you’ve already lost them.
Amazon product infographics are the difference between listings that convert and listings that get scrolled past. High-resolution images can boost sales by up to 10%, and infographics help shoppers understand your product’s value in seconds without digging through long descriptions.
Amazon keeps your main image simple with the required white background, but every image after that becomes your space to shine. Slots 2 through 9 (or more depending on your product category) let you highlight features, answer questions, and show exactly why your product is the right choice.
Ready to build infographics that stand out and drive clicks? Let’s jump in.
What Makes Amazon Product Infographics Convert
A good product infographic is like your favorite wingman: it knows exactly what your customer needs and puts it front and center. Kitchen gadgets? Show off how easy they are. Tech accessories? Flex that compatibility. Supplements? Spotlight those hero ingredients. No matter the format, your mission is simple: make your value pop off the screen, no novel-length captions required.
Here's what separates professional Amazon infographic design from amateur attempts:
Visual Hierarchy Guides the Eye to What Matters Most
Position the product and its primary benefit immediately. Give the most important feature the strongest visual weight, with supporting points stepping down in size. Keep graphics and headings clean and intentional so the infographic is instantly readable without feeling cluttered.
Readable Text Without Zooming in is Absolutely Essential
On the product page, shoppers initially view images at a reduced size before tapping or zooming. If your infographic isn’t clear at first glance, it fails its primary job.
Strategic Use of White Space Prevents a Cluttered Look
Give each element room to breathe. A single powerful statement with ample padding outperforms six cramped bullet points every time.
Brand Consistency Across All 9 Slots Creates Professional Polish
Your color palette, typography, and design style should feel cohesive whether someone views image 2 or image 8. This builds trust and makes your listing memorable.
Amazon Product Image Requirements for Infographics
Amazon's official image requirements exist for good reasons, mostly related to how images display across devices and enable zoom functionality. Here's what you need to know for your product infographics:
Minimum and recommended sizes
- Minimum 1000 x 1000 pixels on the longest side to enable zoom
- Recommended 2000 pixels or more for optimal display quality. (I like to export at 2,500 pixels)
- Maximum 10,000 pixels on the longest side
File formats accepted
- JPEG (.jpg) - preferred for balance of quality and file size
- PNG (.png) - best for graphics with text and sharp edges
- TIFF (.tif) - supports higher color depth
- GIF (.gif) - acceptable but less common
Aspect ratio and fill requirements
- Square format (1:1) works for most products
- 3:4 aspect ratio is accepted, but less common
- File size under 10MB for fast loading
Background requirements for additional images
- Main image requires pure white background and must fill 85% or more of the frame
- Additional slots 2-9 can use colored or lifestyle backgrounds
Most Amazon infographics perform best as high-quality JPGs at 85-90% quality settings when they include photographs. Use PNG when your infographic is primarily text and graphics with no photographic elements.
Common Amazon Infographic Design Mistakes
Text-Heavy Designs Don’t Work on Mobile
Over 70% of Amazon shoppers browse on mobile, where images are viewed quickly and at smaller sizes. Tiny text and decorative fonts are hard to read and easy to skip. If your infographic needs multiple paragraphs to explain a feature, it’s doing the job of a blog post, not an infographic. Strong infographics communicate the benefit instantly, without requiring shoppers to zoom in and read.
Overly Cluttered Infographics Get Skipped Entirely
Too much text or excessive icons overwhelm shoppers, making it difficult for them to quickly grasp the key benefits. Keep it clean and easy to understand, or customers will scroll past.
Ignoring Your Category Conventions Confuses Shoppers
Supplements should show ingredients and dosage. Electronics need compatibility charts. Kitchen products require dimension comparisons. Study the top 10 listings in your category and identify the visual patterns that repeat. Those exist because they work.
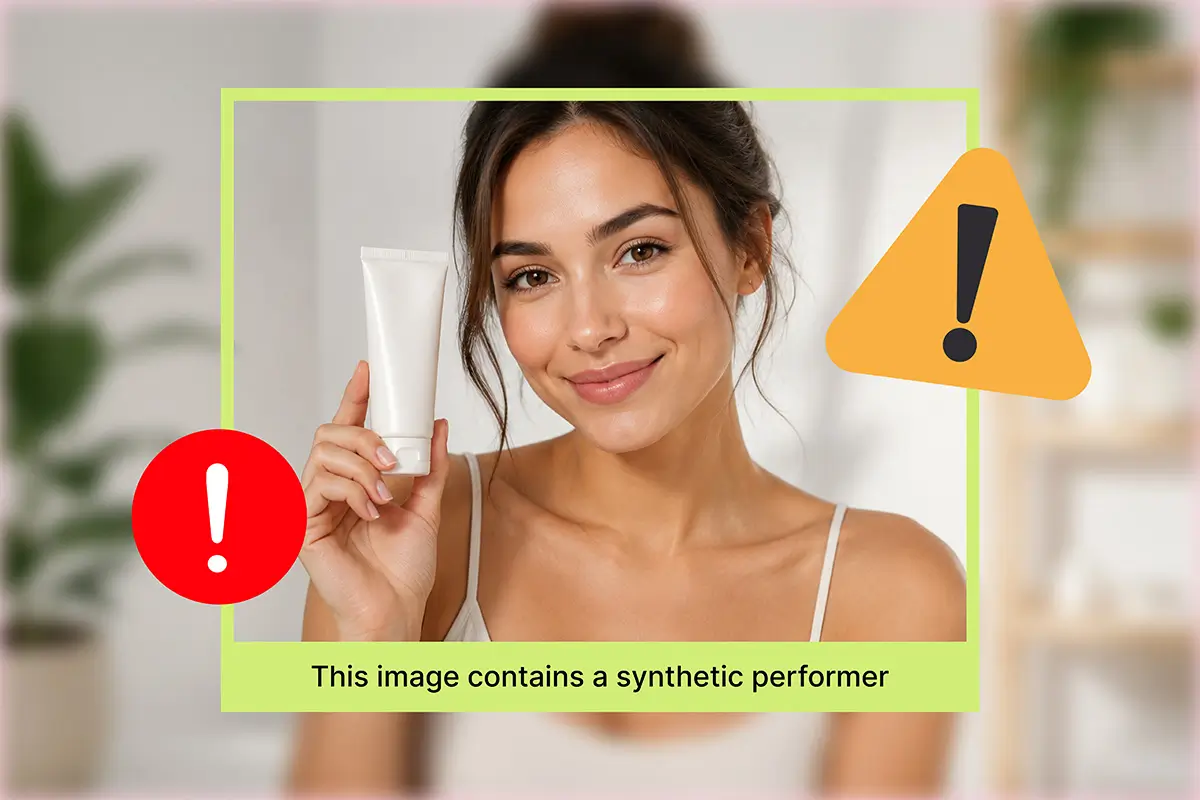
Bad Photos Make Good Products Look Cheap
Blurry images, bad lighting, stock photos, or obvious AI visuals make products feel low quality. Start with clean, accurate product photography, then use infographics to explain benefits. Design should support the product, not try to fix weak photos.
Not Using Zoomable Images
Amazon's zoom feature builds customer confidence by allowing them to inspect details. Upload at a minimum of 1000 pixels; 2000+ pixels provide the best zoom experience.
Analyze Competitor Infographics to Find Your Edge
As Ricky Bobby famously said, 'If you ain't first, you're last.'
That same logic applies to your search ranking on Amazon. Instead of guessing what might work, look at what already is. Study your top ten competitors to understand the visual strategies driving their sales, then identify the gaps they’re leaving behind.
What to Look For
Check their product images and note:
- What infographic types do they use most? (features, dimensions, how-to, social proof)
- What information do they prioritize?
- What's their design style? (clean and minimal or text-heavy)
Your Strategy
Match the basics: If 8 out of 10 competitors show dimensions or ingredients, you need those too. It's a category expectation.
Fill the gaps: Create infographics that answer the questions competitors ignore.
Execute better: When everyone else is cluttered, clarity wins. Make your visuals cleaner, easier to scan, and the best-looking in the category. Amazon is competitive, and design is part of the fight.
Check competitors quarterly. What works today might be outdated in six months.
Why Image Order Matters for Amazon Listings
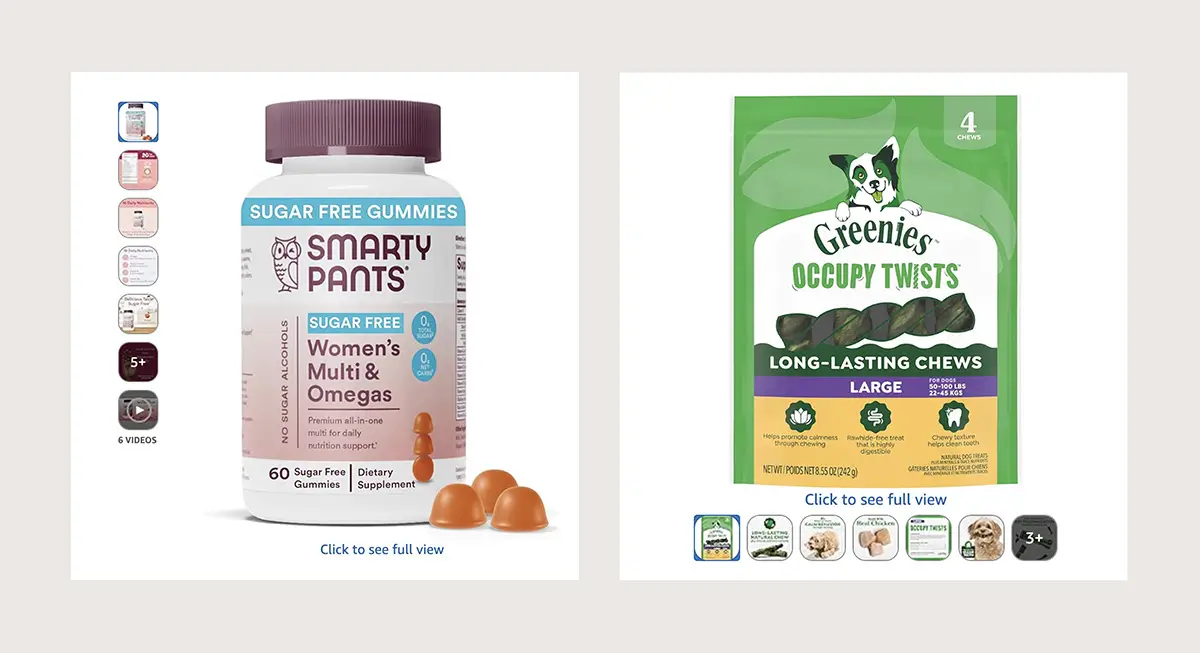
On desktop, Amazon shows only the first four to five images in the product gallery by default. If you have additional images or a video, they appear behind a “+” overlay on the last visible thumbnail. Many shoppers never click to view the rest, which makes those first images do most of the heavy lifting.
This means you need to frontload your most critical information in slots 2-5:
- Your strongest benefits and key differentiators must appear in the first visible slots
- Primary use cases and feature breakdowns belong here too
- Save additional features and trust signals for slots 6-9
- Assume most shoppers will only see your first five images and make those count
Types of Amazon Product Infographics That Sell
Different infographic styles serve different strategic purposes. Amazon supports a wide range of infographic types, but some are consistently more effective than others.
Here are the most common and highest-performing infographic styles for Amazon product listings:
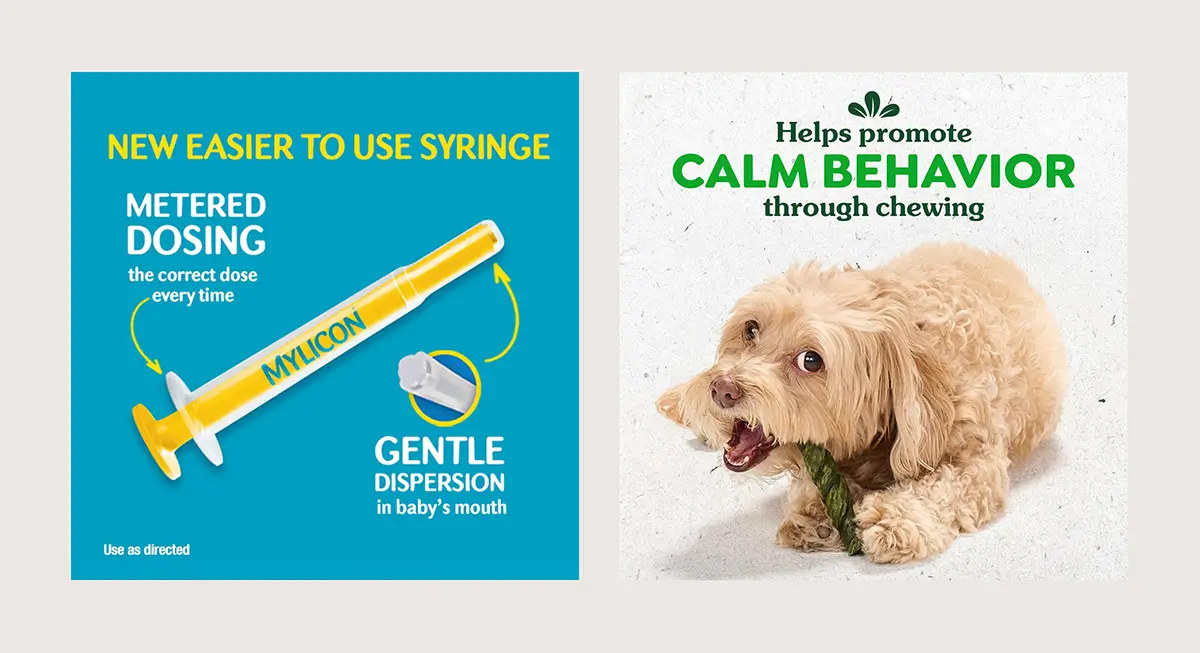
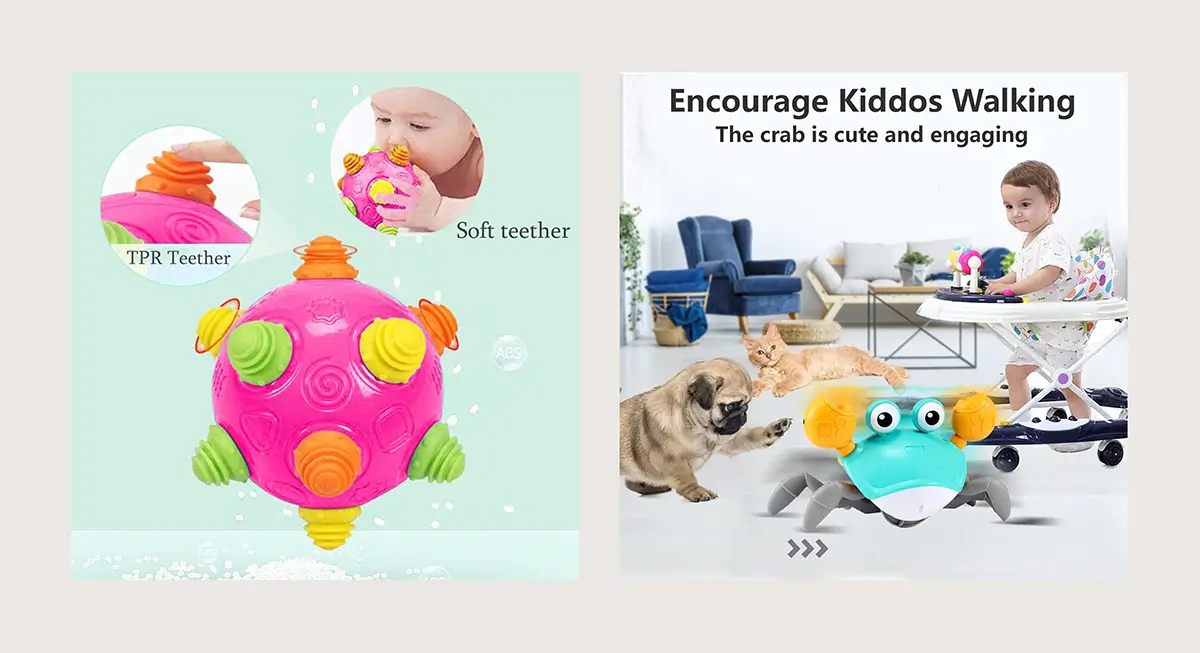
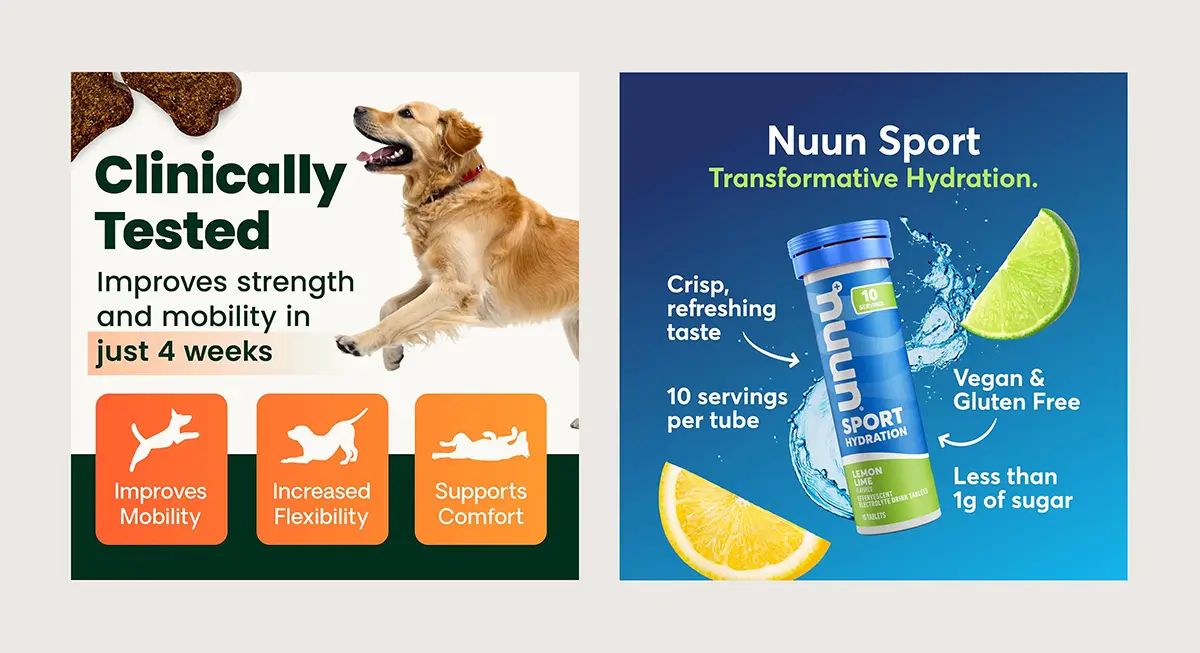
Features and Benefits Infographics
Use callouts, icons, or zoomed-in visuals to highlight what makes your product unique. This helps communicate key features visually, making complex details easier to understand at a glance.
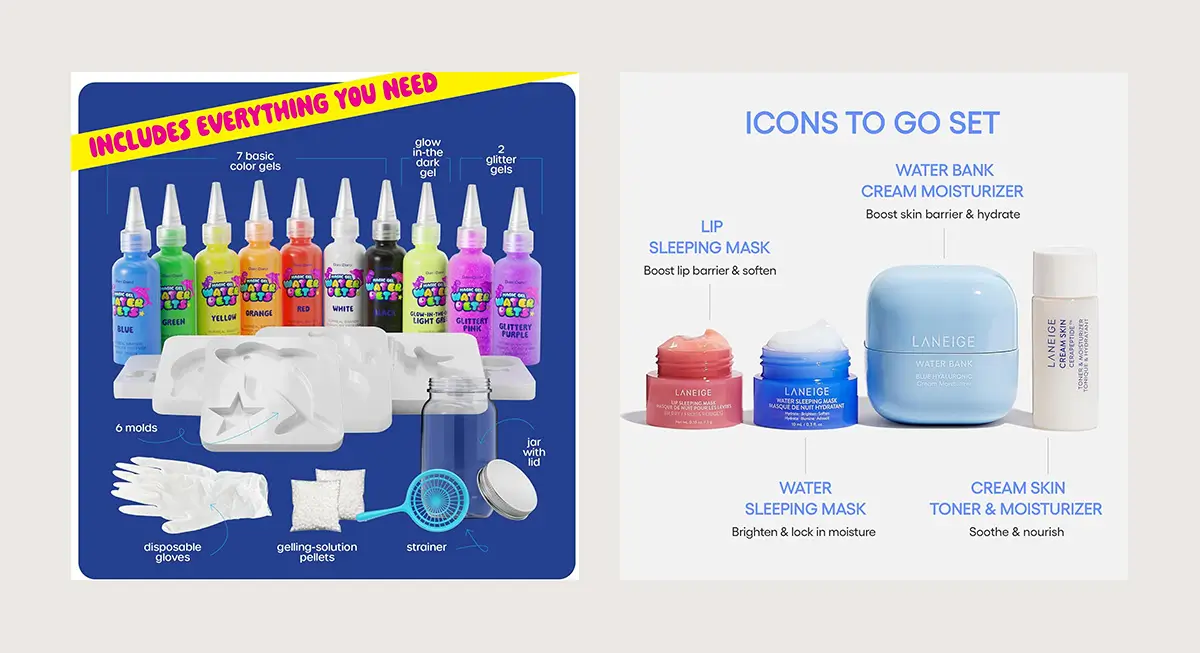
Package Contents Infographics
Display everything included in the bundle so shoppers know exactly what they’re getting. Clear visuals set expectations, build confidence, and help prevent confusion or returns.
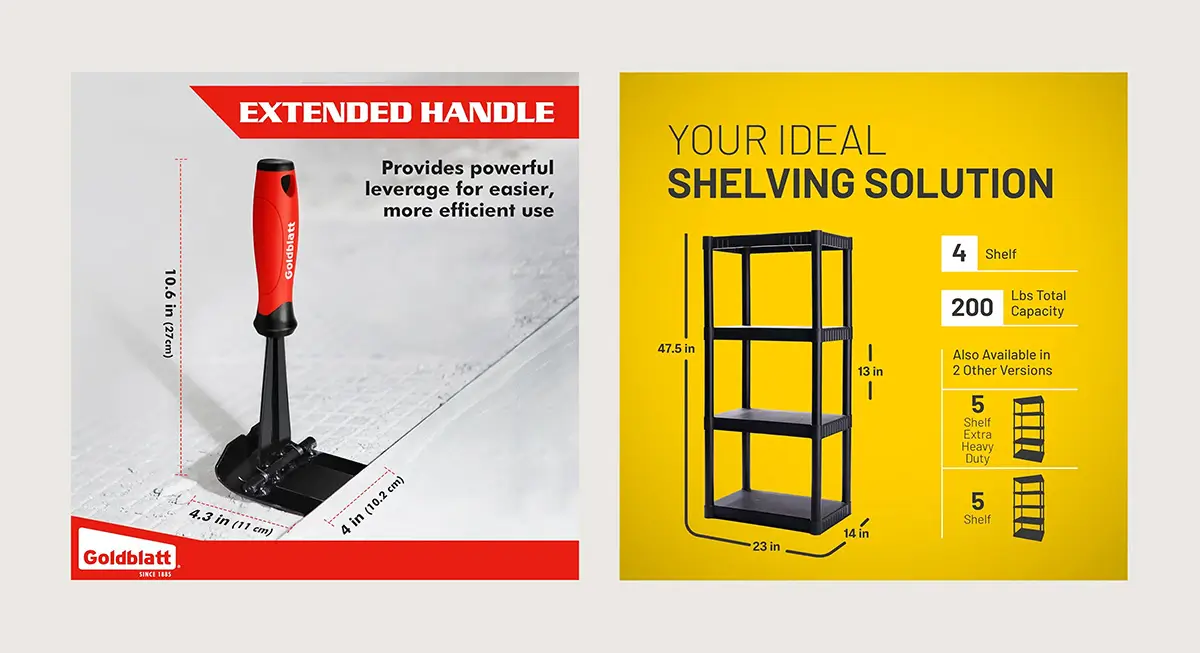
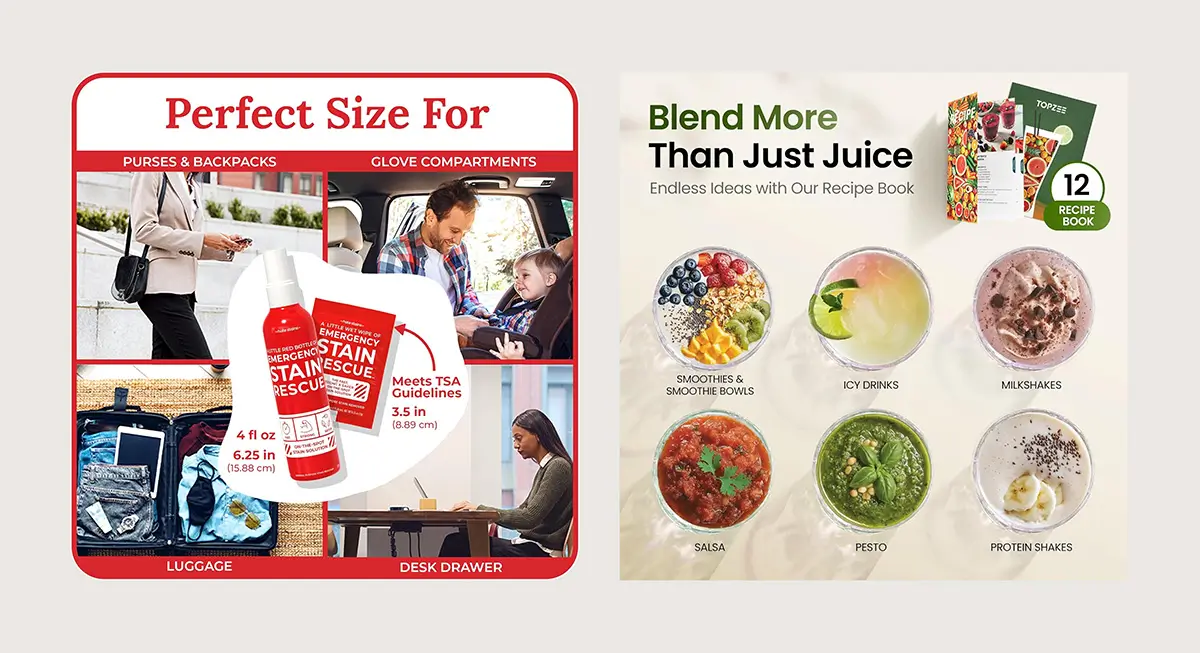
Dimensions Infographics
Help shoppers understand size and fit at a glance by using clear measurements or reference objects. Removing guesswork around scale makes buying decisions easier and reduces hesitation.
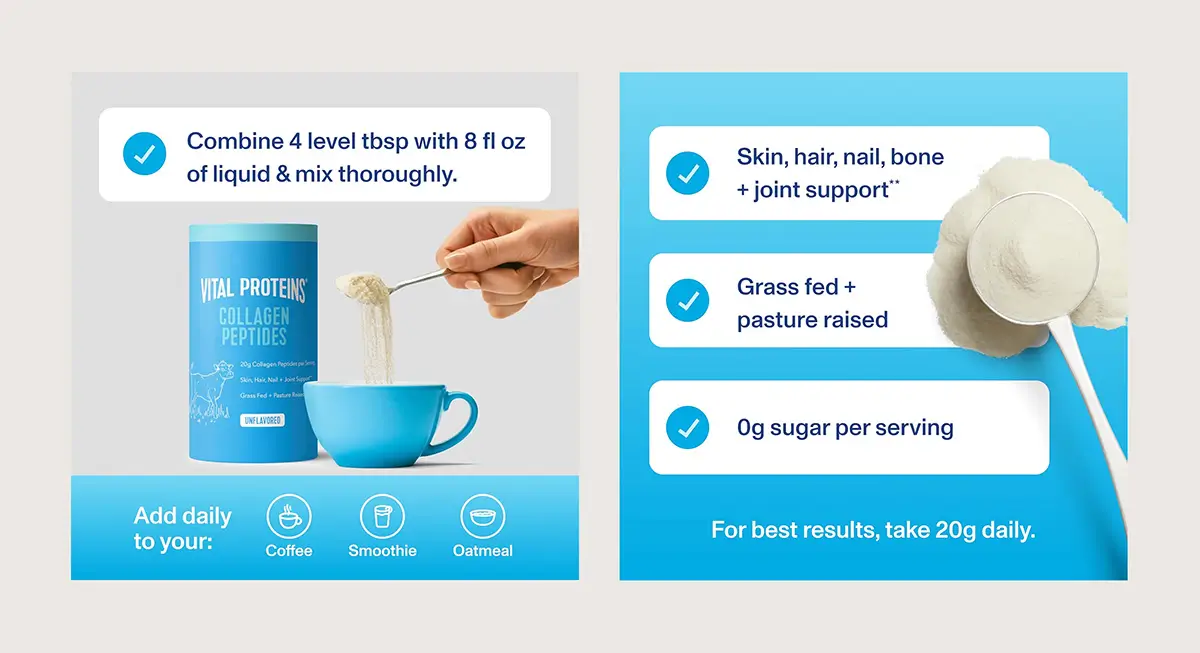
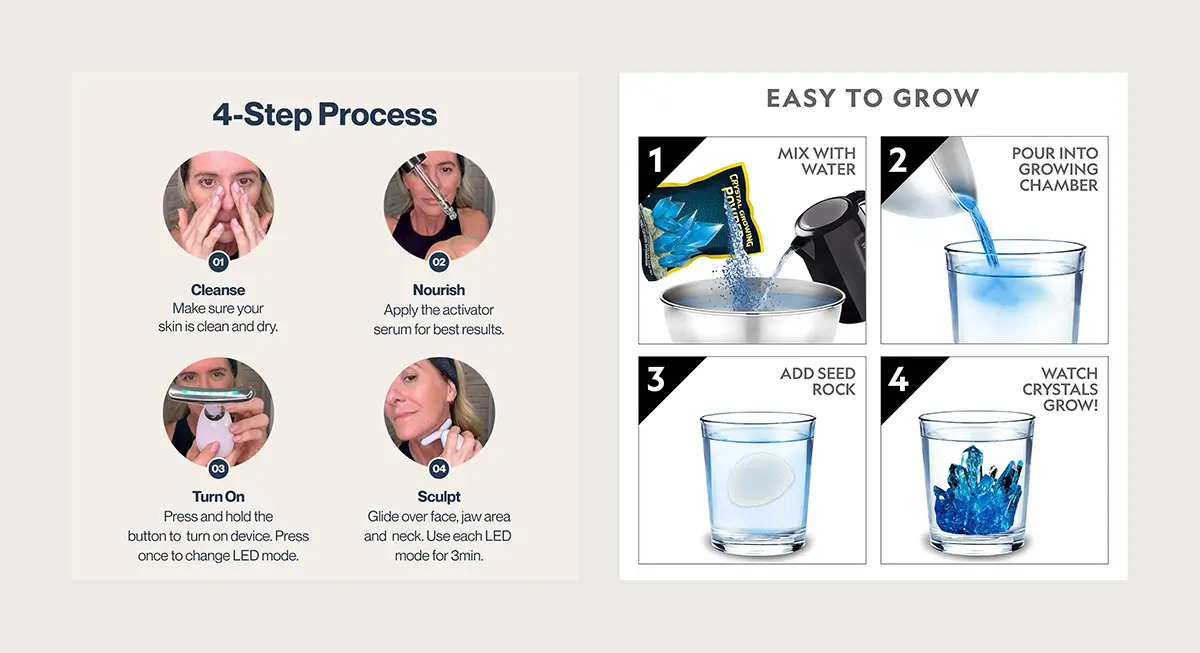
How-to Infographics
Provide step-by-step visuals for products that require assembly or specific usage. Clear guidance reduces confusion, builds confidence, and makes the product feel easier to use right away.
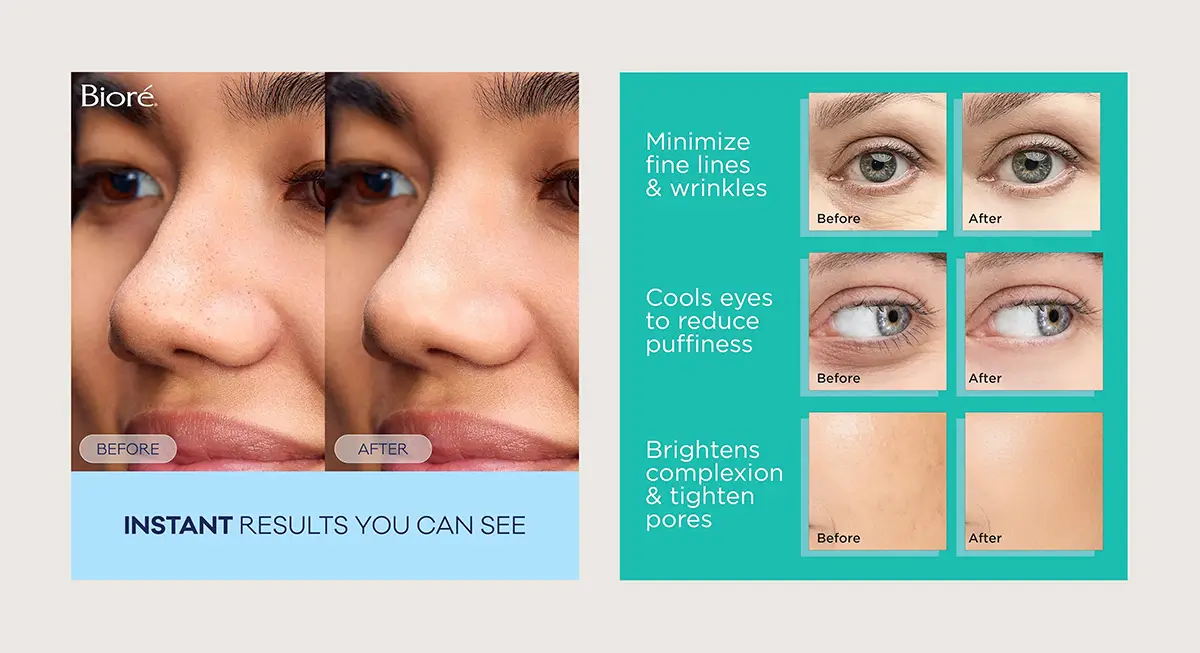
Before-and-After Infographics
Showcase visible results. Perfect for skincare, cleaning products, or fitness equipment where transformation sells the product.
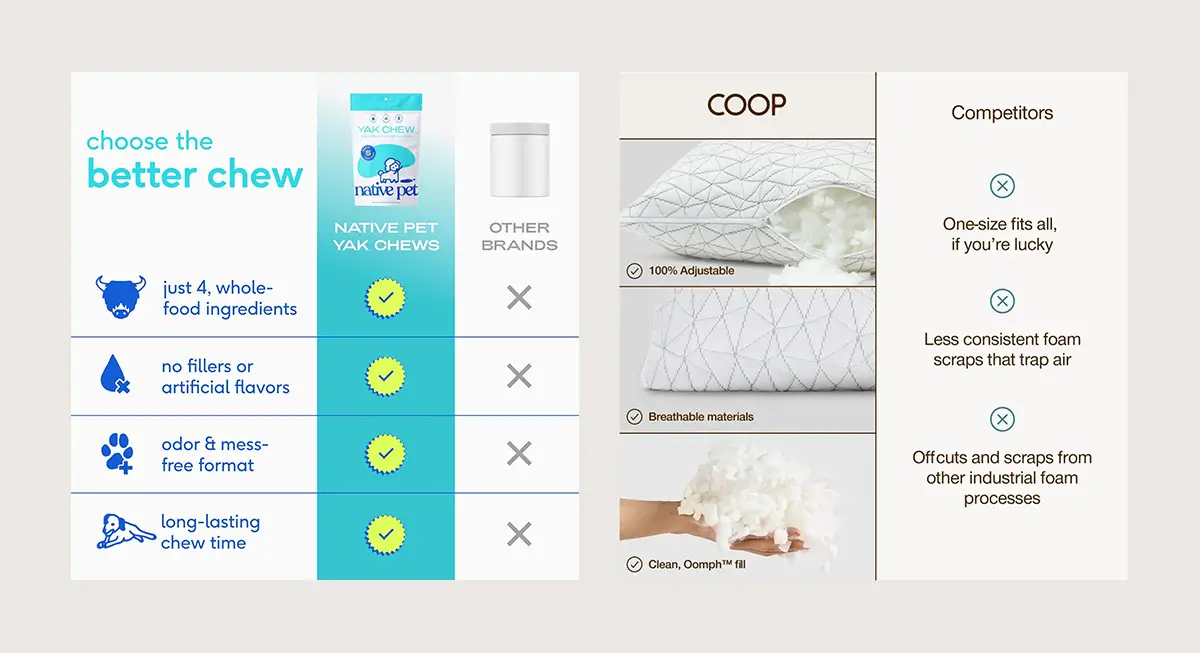
Comparison Chart Infographics
Position your product as the stronger option without naming competitors. Clear, visual comparisons help shoppers quickly understand the advantages and make confident decisions.
Use Case Infographics
Highlight practical scenarios that show when and how the product works best. This helps shoppers visualize ownership and reduces uncertainty.
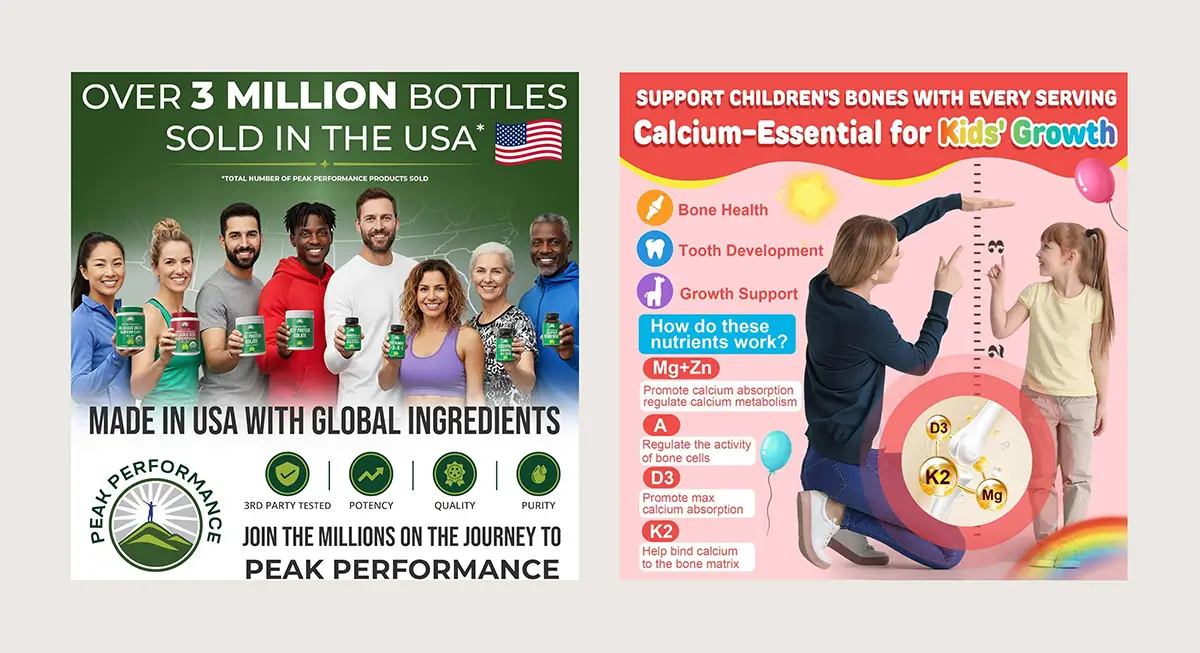
Social Proof Infographics
Show real people using the product, highlight accolades, review metrics, or trust badges to reinforce credibility and reduce buyer hesitation.

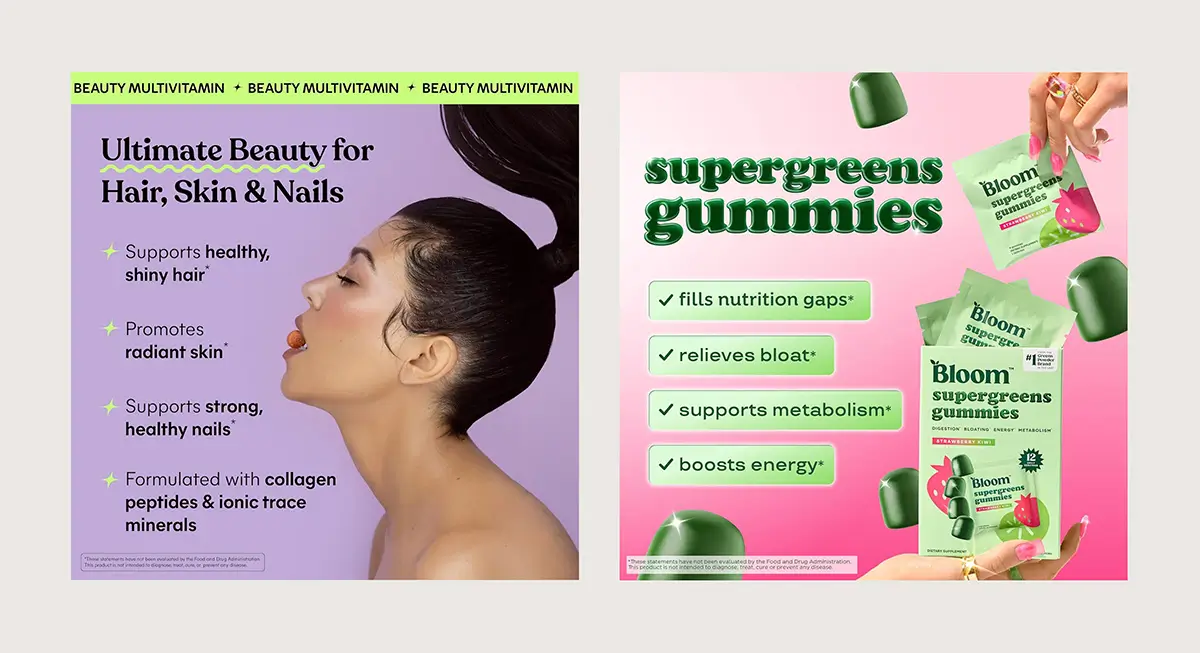
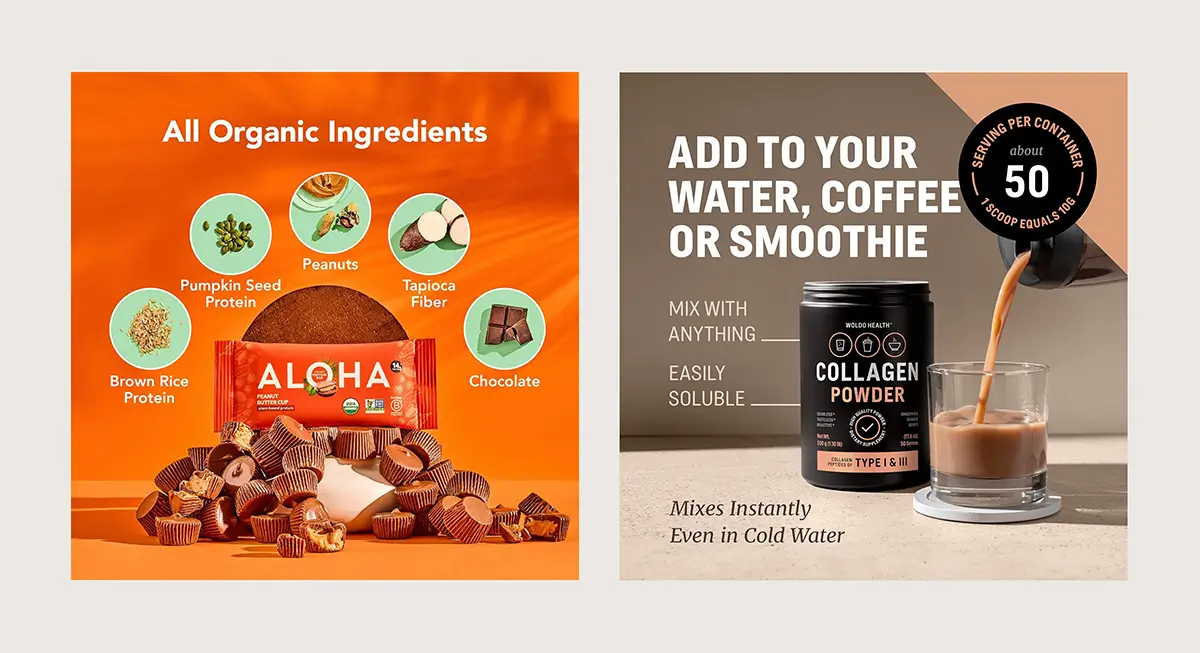
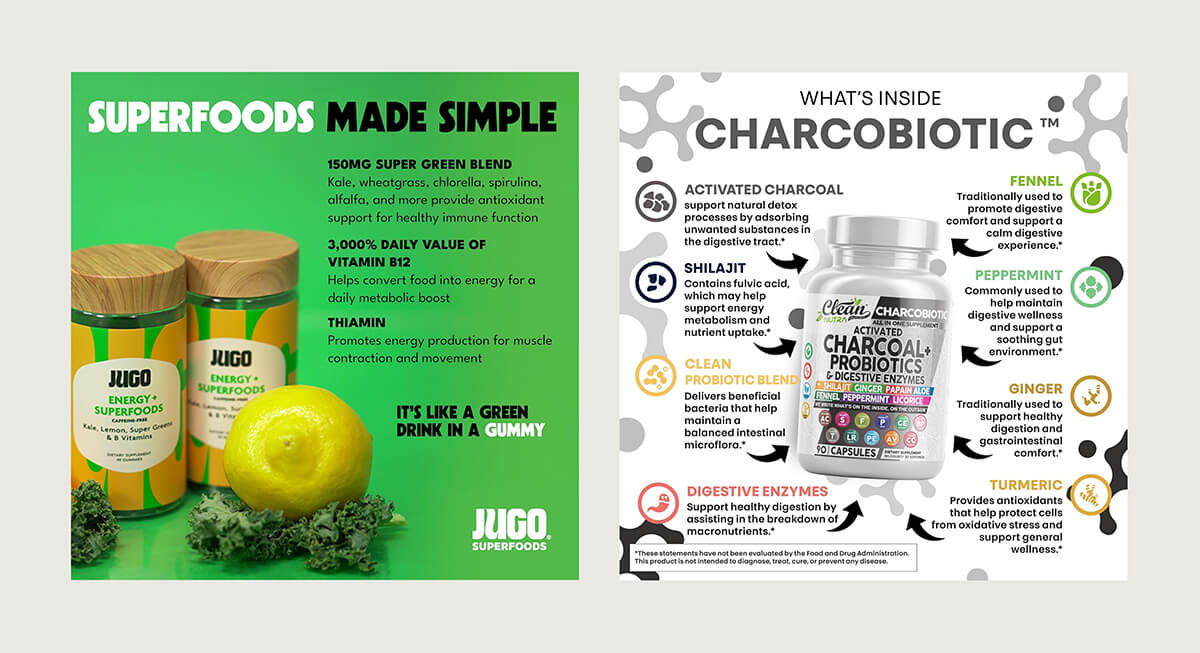
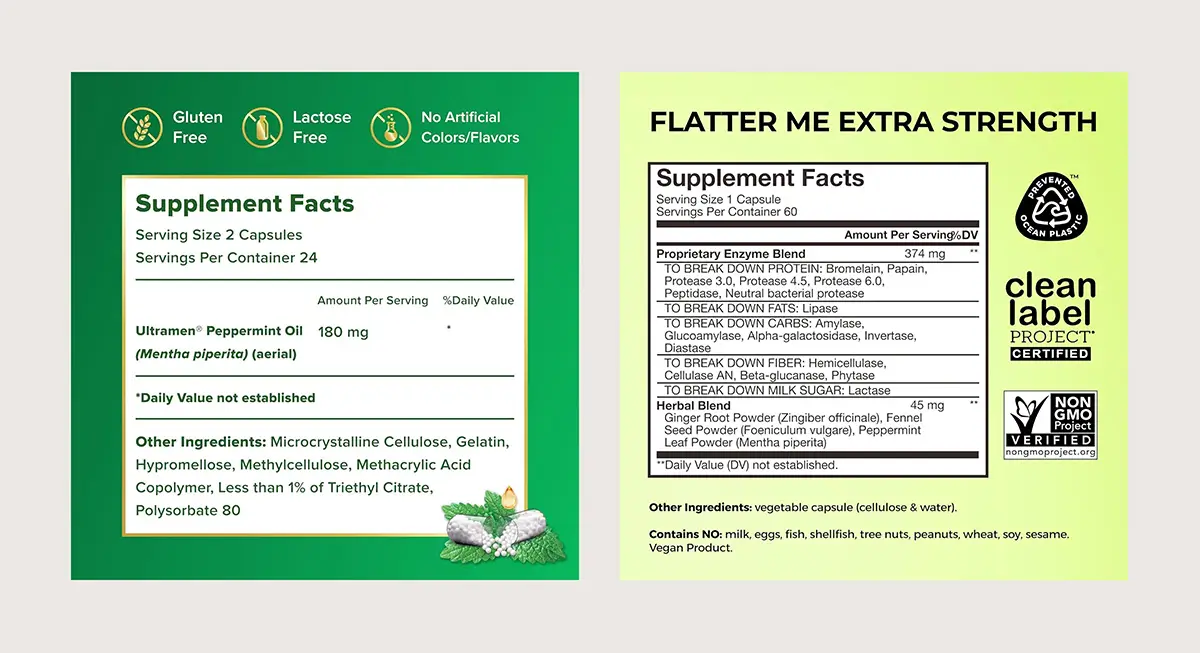
Ingredients Infographics
Clearly show what’s in the product and why it matters. Highlight key ingredients, sourcing, and what’s intentionally left out to build trust and transparency.
Mining Customer Reviews for Infographic Improvements
Your negative reviews are a goldmine for infographic optimization. Customers tell you exactly what information was missing from your listing, and those gaps often point to infographic opportunities you overlooked.
Common Review Complaints That Signal Missing Infographics
“I didn’t realize it was this small”
Add a dimensions infographic with clear measurements and real-world size comparisons.
“It doesn’t work with my device”
Create a compatibility chart infographic that shows exactly what it works with and what it doesn’t.
“I thought it came with batteries or accessories”
Design a package contents infographic that clearly shows everything included in the box.
“The instructions weren’t clear”
Add a how-to infographic that visually explains setup or proper use.
“The color looked different in photos”
Include accurate color variations and note lighting or screen differences where needed.
“It’s too complicated to assemble”
Create a step-by-step assembly infographic that simplifies the process.
“The material feels cheaper than expected”
Add a materials breakdown infographic that clearly shows what it’s made of and why it matters.
How to Use Reviews to Improve Your Infographics
Sort by most recent 1-3 star reviews: Read through the last 50-100 negative reviews and look for patterns. If five customers mention confusion about sizing, that's your next infographic priority.
Create a pain point tracker: Keep a simple spreadsheet listing common complaints and how many times each appears. Sort by frequency to identify what information gap costs you the most sales or creates the most returns.
Look for question patterns in Q&A sections: If the same questions keep appearing in your product Q&A, those are signals that your infographics aren't doing their job. Answer those questions visually in your image slots.
Check competitor reviews too: Read negative reviews on similar products in your category. If customers consistently complain about the same issue across multiple listings, create an infographic that proactively addresses that pain point. This gives you a competitive advantage.
Update infographics quarterly based on feedback: Set a calendar reminder every 90 days to review recent feedback and refresh at least one infographic based on what you've learned. Markets evolve, customer expectations shift, and your visuals should keep pace.
Your infographics should answer those needs visually before the purchase happens. If customers are still asking questions or expressing disappointment after delivery, your infographics have work to do.
How Amazon Infographics Impact Your Bottom Line
High-quality product infographics aren't just about aesthetics. They directly impact conversion rates and reduce returns:
Higher Engagement & Retention
Once a shopper clicks your listing, you only have seconds to keep them interested. Compelling infographics hook the shopper immediately, increasing time-on-page and preventing them from "bouncing" back to the search results to check a competitor.
Improved Conversion Rate
Detailed infographics answer customer questions and build confidence, directly leading to more sales. By visually answering common objections (like "will this fit?" or "is it compatible?"), you remove the hesitation that kills conversions.
Reduced Return Rate
Accurate infographics that show specific dimensions, package contents, and realistic usage scenarios minimize the gap between customer expectations and reality. When customers know exactly what they are getting, they are far less likely to return it.
Enhanced Customer Satisfaction
Clear visuals create a positive unboxing experience because the product matches the promise. When customers feel well-informed, they are more likely to leave positive 5-star reviews and become repeat purchasers.
When to Hire Professional Infographic Services
DIY design tools like Canva work fine for basic products in non-competitive categories. If you're selling commodity items where price is the main differentiator, investing in custom Amazon infographics probably won't move the needle enough to justify the cost.
Professional Amazon design services become essential when:
- Your product is visually complex and needs strategic feature highlighting that templates can't accommodate. Tech products, multi-component items, and products with specific use cases fall into this category.
- You're in a highly competitive category where visual quality directly impacts conversion rates. Supplements, beauty products, and popular gadget categories see massive ROI from professional infographic design because shoppers are comparing dozens of similar options.
- Your brand positioning justifies premium pricing. If you charge 30% more than competitors, your product infographics need to communicate why that premium exists. Template-based designs undermine premium positioning.
- You need conversion optimization, not just pretty pictures. Professional designers analyze category conventions, test visual hierarchies, and structure information flow to maximize click-through and conversion rates. Templates optimize for aesthetic appeal, not business results.
Combining Infographics with A+ Content
While product infographics provide visual information at the top of your listing, A+ Content (Enhanced Brand Content) works below the bullet points to create a comprehensive presentation.
Basic A+ Content can increase sales by up to 8% by allowing you to:
- Expand on product features with detailed descriptions and visuals
- Tell your brand story and connect emotionally with customers
- Address frequently asked questions
- Use comparison charts and module layouts
Premium A+ Content offers even more powerful features and can boost sales by up to 20%:
- Interactive modules with clickable hotspots on images
- Video integration
- Enhanced brand storytelling modules
- Fully responsive mobile-optimized design
To access Premium A+ Content, you need to be brand registered, submit an approved brand story, and have at least five A+ Content pieces published in the last 12 months.
Testing and Optimizing Your Amazon Infographics
Great product infographics aren't designed once and forgotten. Top sellers continuously test and refine based on data.
Amazon Brand Registry Offers A/B Testing
Use Manage Your Experiments to test different messaging, visual styles, or image sequencing. Run each test for at least two weeks to account for normal traffic fluctuations. Prioritize click-through rate first, then evaluate conversion rate once engagement improves.
Track Your Detail Page Views and Conversion Rate Before and After Updates
Don't change multiple variables simultaneously, or you won't know what caused the performance shift. Update one or two infographics at a time, wait for statistical significance, then iterate.
Study Your Competitors' Top Performers Quarterly
Category visual conventions evolve. What worked last year might be table stakes this year. If the top 5 listings in your category all started showing a specific type of Amazon infographic, there's probably a reason. Adapt or fall behind.
Optimize for Mobile Viewing
Preview every product infographic on an actual phone screen before uploading. Images should retain clarity and detail even when viewed on mobile. If you can't read the key message in two seconds on a phone, redesign it. Most of your traffic comes from mobile devices.
Use Keyword-rich File Names and Alt-text
While visual appeal drives conversions, don't ignore SEO. Use relevant keywords in your image file names and write descriptive alt-text for each image. This helps Amazon understand your content and improves search visibility.
Start Improving Your Amazon Product Infographics Today
Standout Amazon product infographics catch the eye in crowded search results, spotlight what sets you apart, and nudge shoppers closer to buying. Begin by reviewing your current images with the tips in this article, then zero in on the areas that need the most improvement and tackle those first.
While templates can be a quick fix, investing in thoughtful infographic design pays off with more sales and fewer returns. Whether you bring in an expert or hone your own skills, see your product infographics as a powerful tool to boost conversions, not just another expense.
Best-selling listings aren’t lucky. They combine solid products with visuals that do the explaining. Your infographics either sell for you or quietly work against you.